
2026 Generic Congressional Ballot
Last updated: July 26, 2026
What is this?
This page tracks something polls usually don’t show: whether support is stable or fragile.
A party can lead in the average (e.g. Democrats +6) while individual pollsters are seeing their numbers move around underneath. This monitor separates real movement from pollster disagreement.
This is not a prediction of who will win. It’s a structural health check, updated as new polls come in.
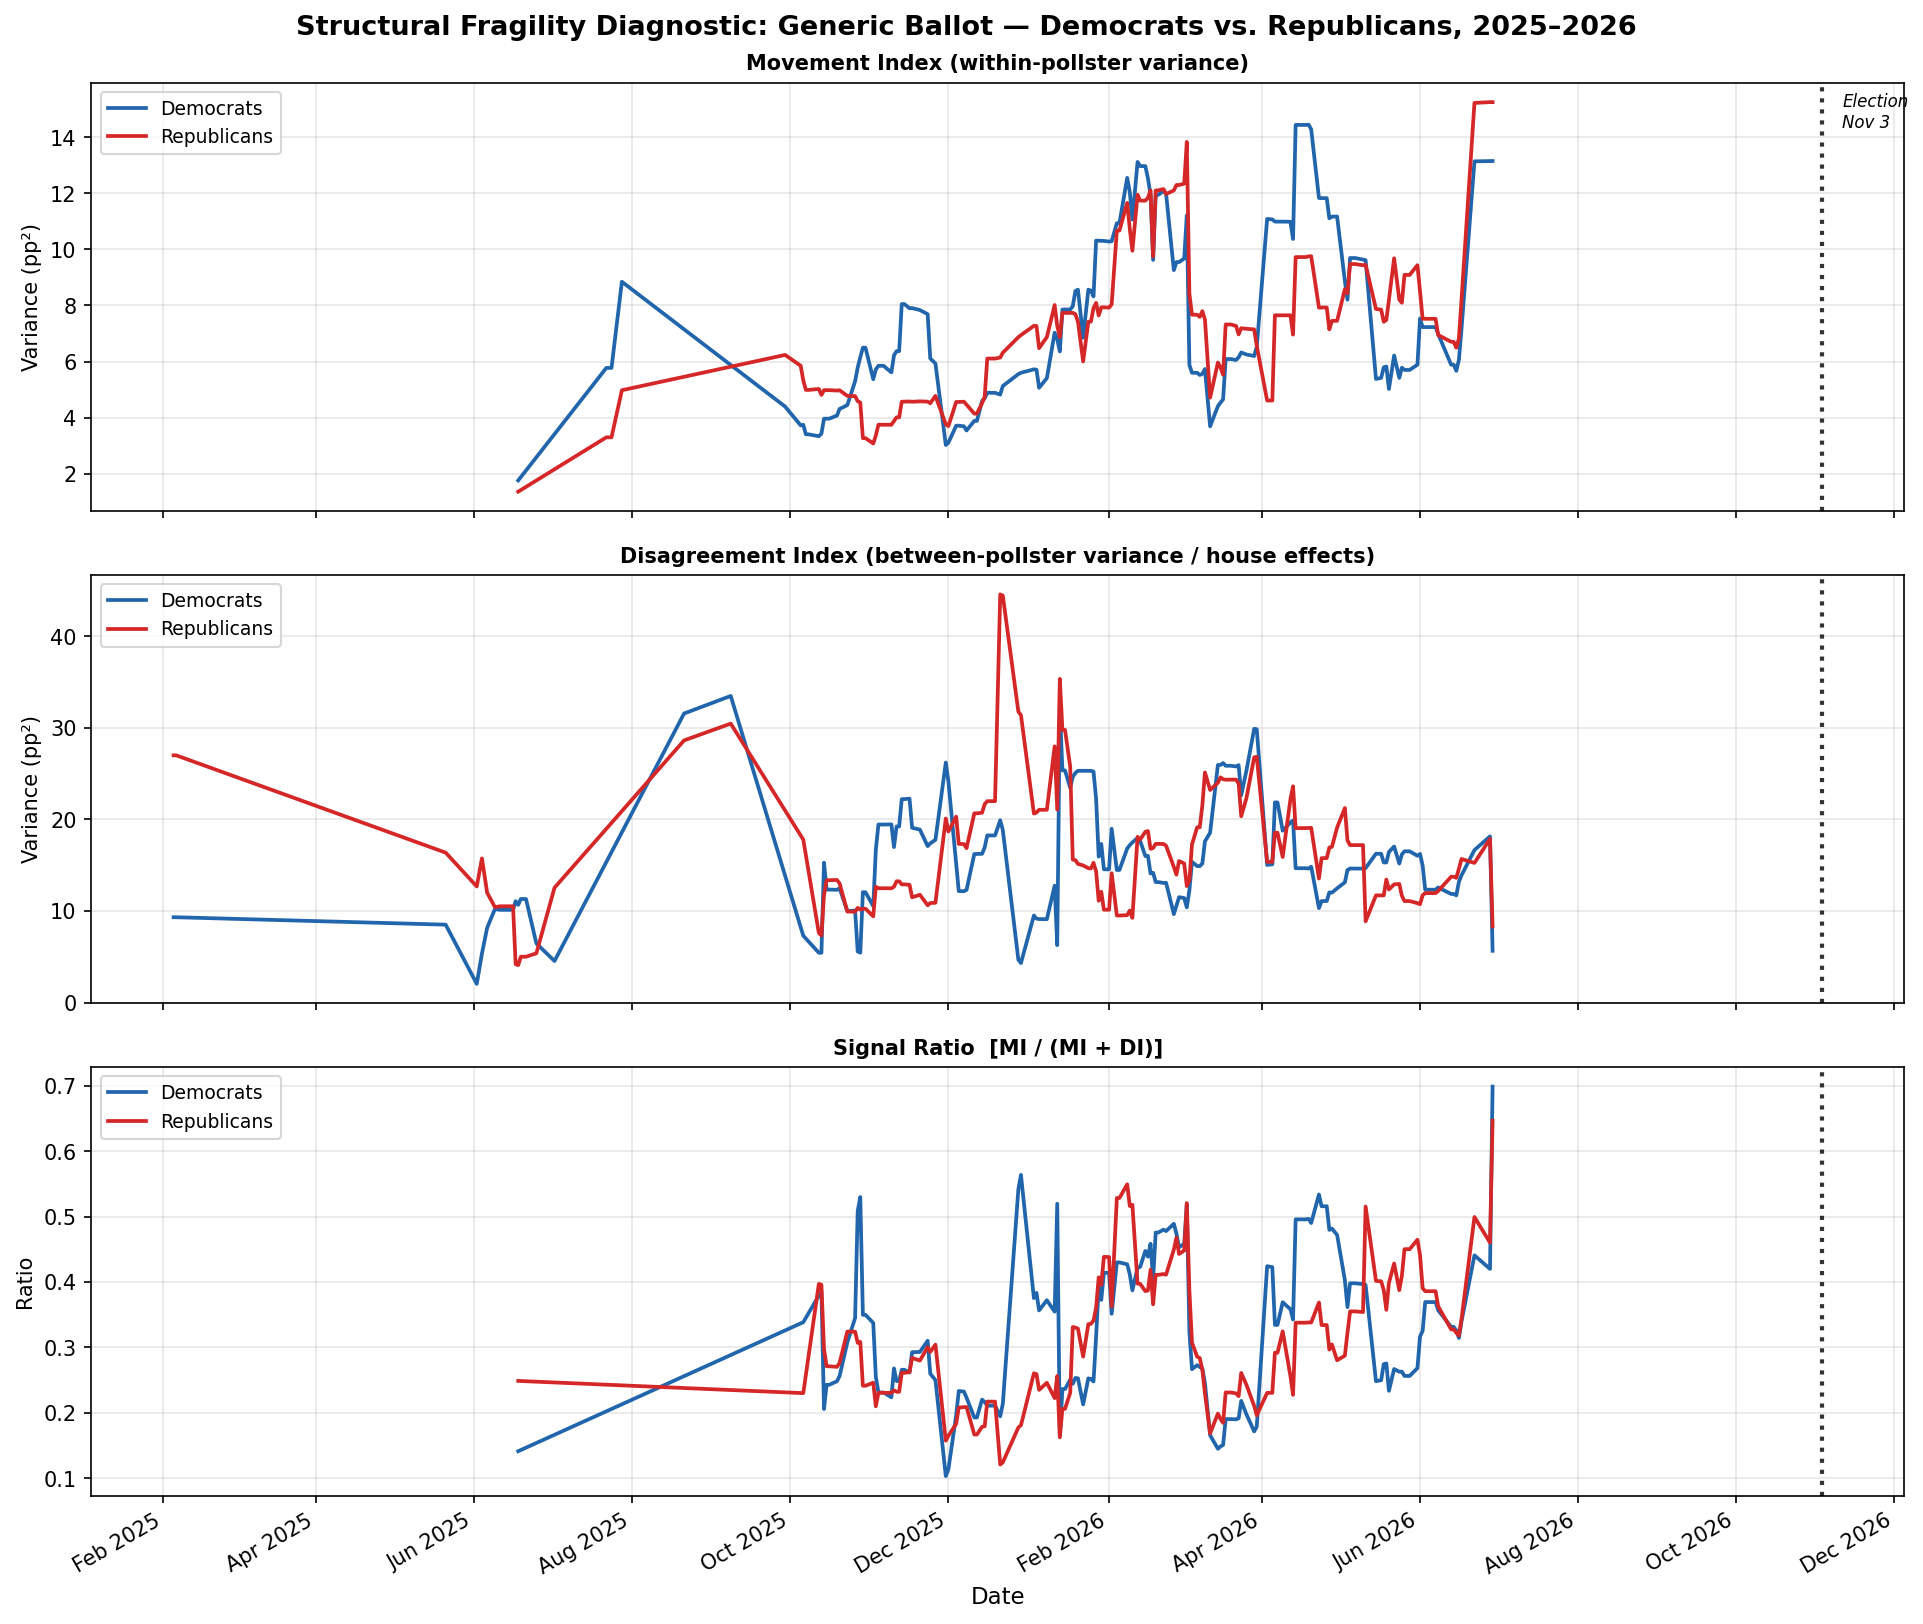
How to read the charts
Blue = Democrats. Red = Republicans.
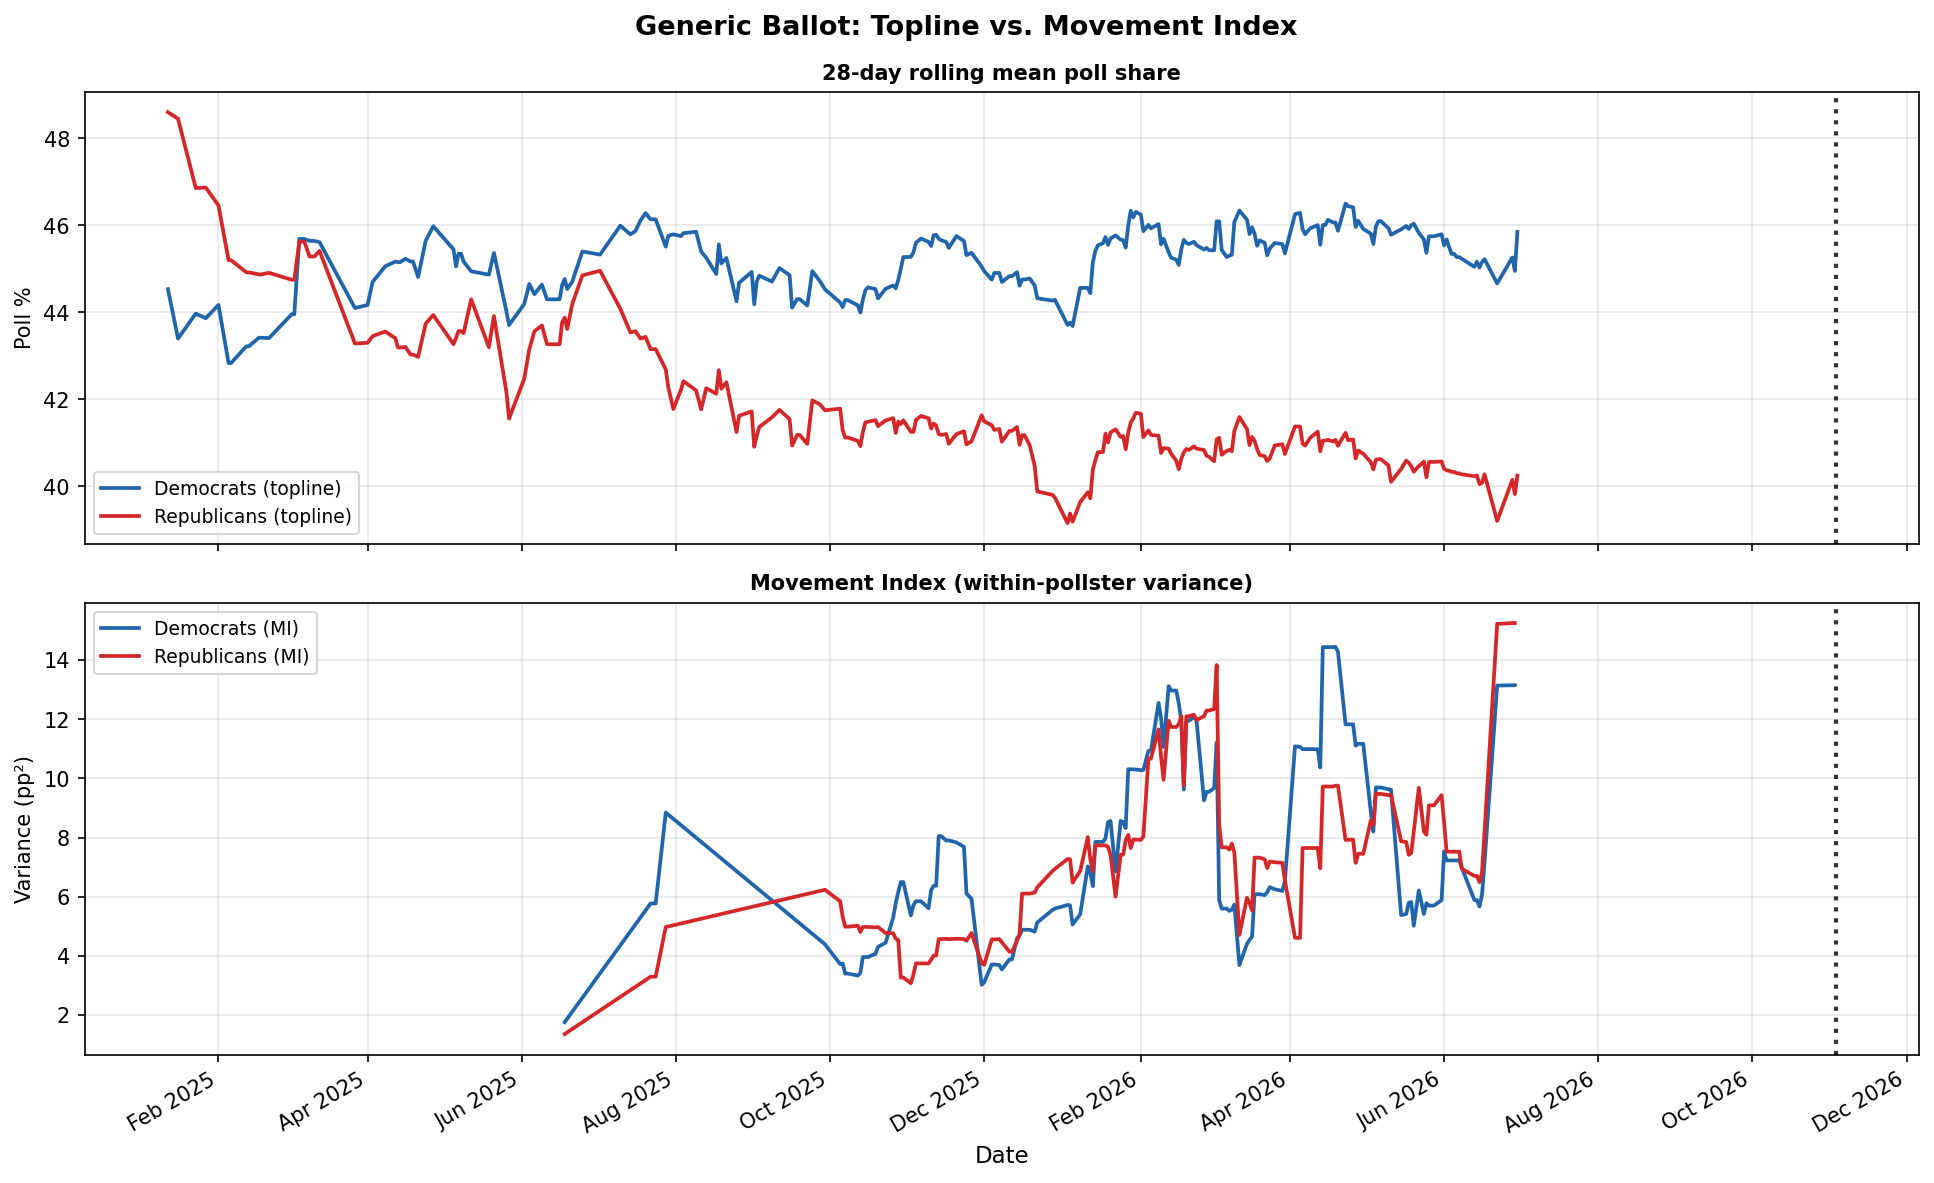
Top panel (Movement Index): Are each pollster’s own numbers jumping around? Higher = more instability.
Middle panel (Disagreement Index): Are pollsters disagreeing with each other? (Often methodology, not real shifts.)
Bottom panel (Signal Ratio): How much of the noise is real movement vs pollster disagreement?
If one side’s Movement Index rises while the average looks flat, that side may be structurally fragile — even when the topline doesn’t show it yet.
July snapshot: see analysis below the charts
Where things stand — July 2026
The headline: Democrats still lead the generic ballot nationally (~D+5–6 as of June 30). No new July generic-ballot polls on VoteHub yet, so the national structural read is unchanged from July 14.
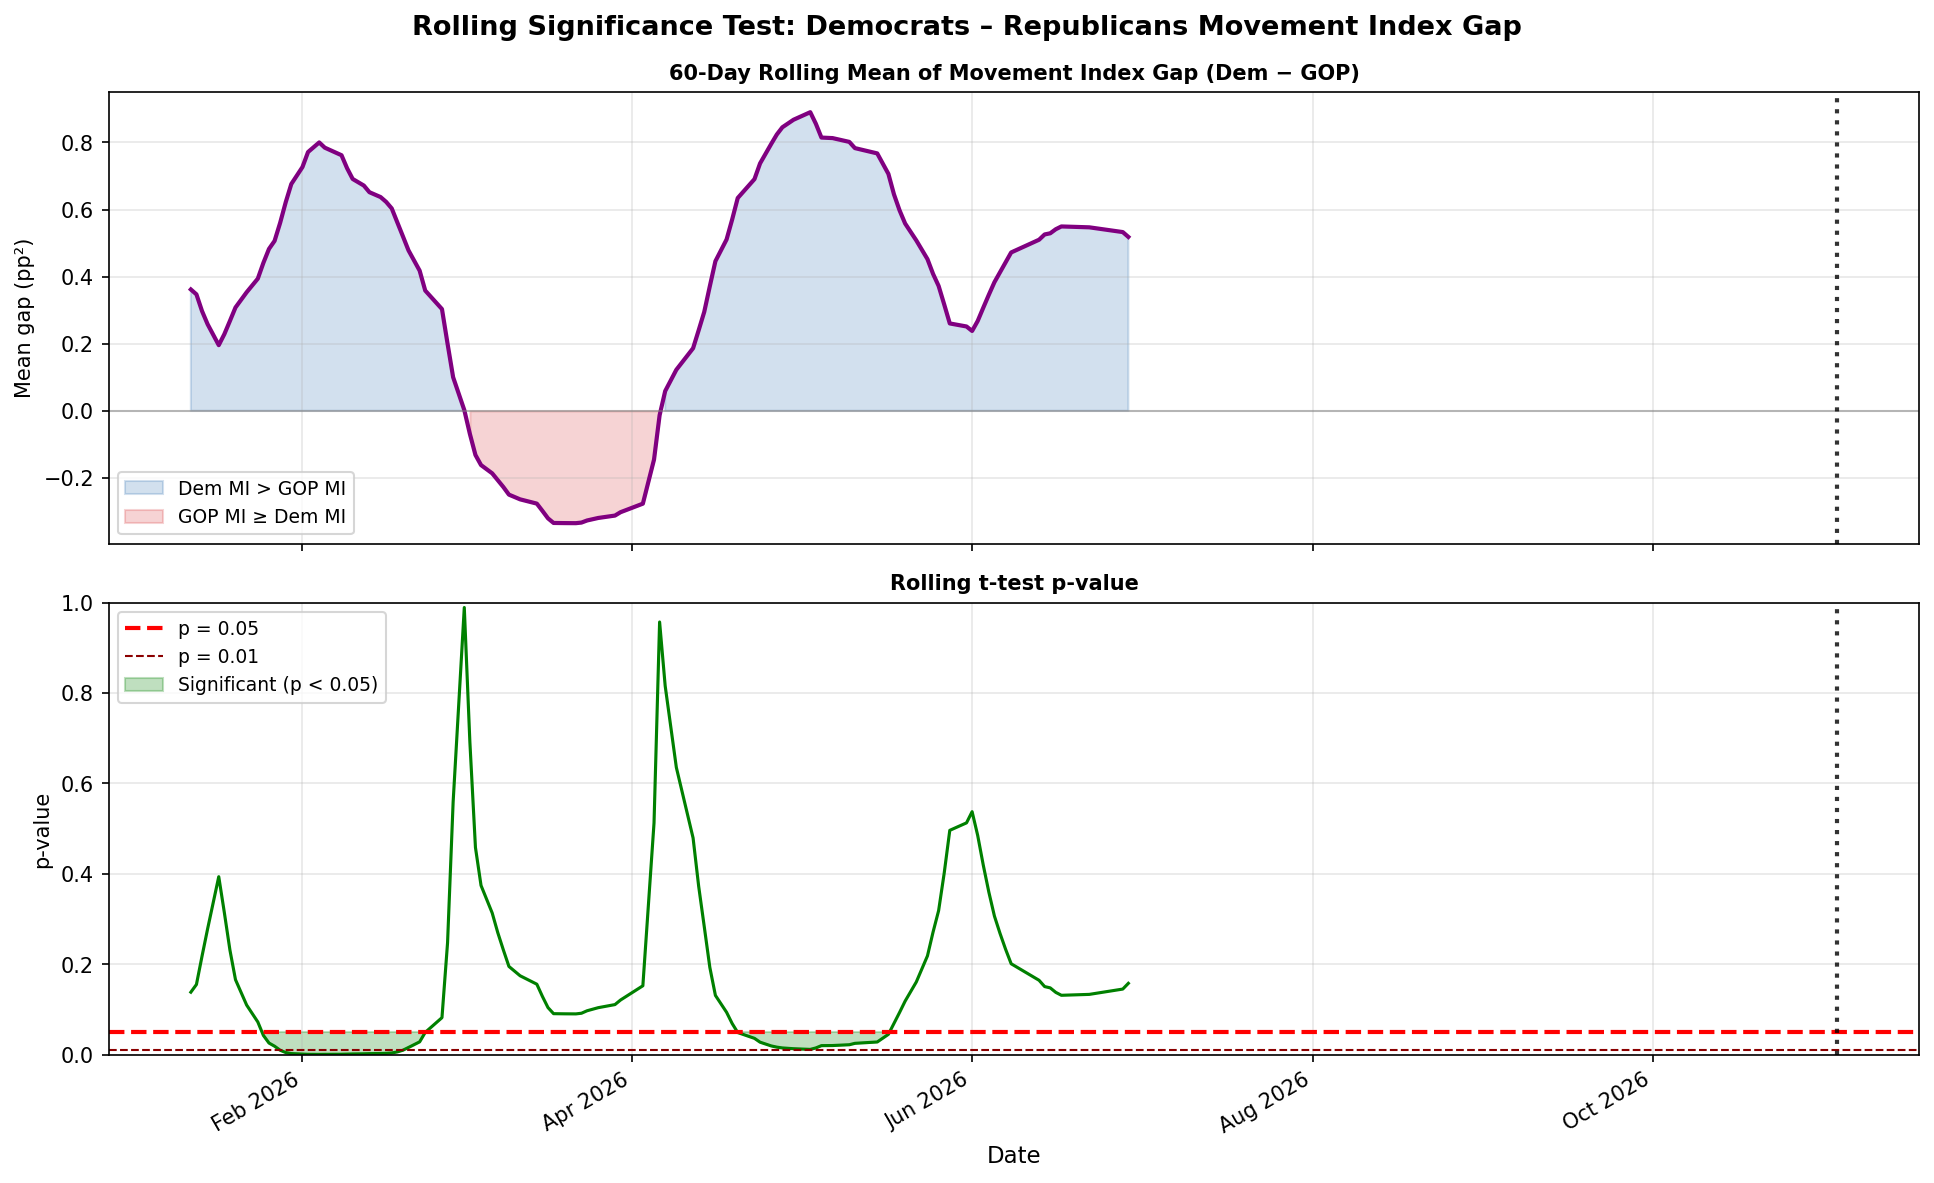
What the charts show: GOP Movement Index still higher than Dems’ (~15.3 vs ~13.2); 90-day gap still not statistically significant. No Biden-style “fragile but flat” signal on Democrats.
Senate races: KY unchanged (one poll). TX still a toss-up (A2: Talarico 48.4, Paxton 46.1). Maine — Platner withdrew July 8; the preregistered Platner–Collins matchup is frozen. Early UNH matchup: Jackson 49%, Collins 46%.
Bottom line: National picture on hold for new polls. Maine is the week’s story for the prospective study. Not a forecast.
Kentucky Senate Race: Barr Vs. Booker
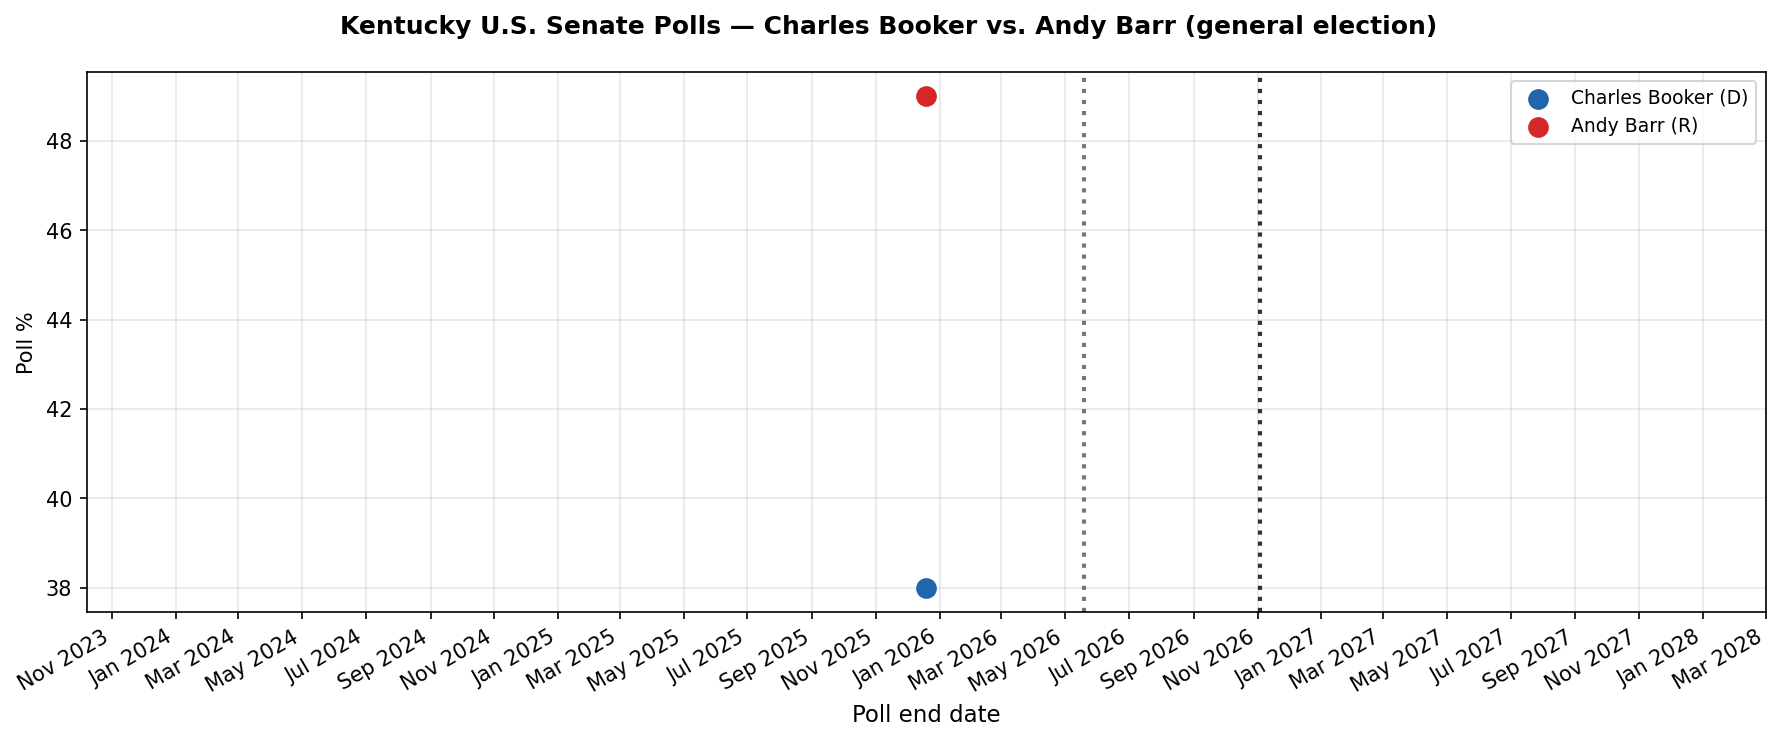
Kentucky U.S. Senate (Booker vs. Barr) — KY still one poll (Barr +11).
Texas Senate — Talarico vs. Paxton
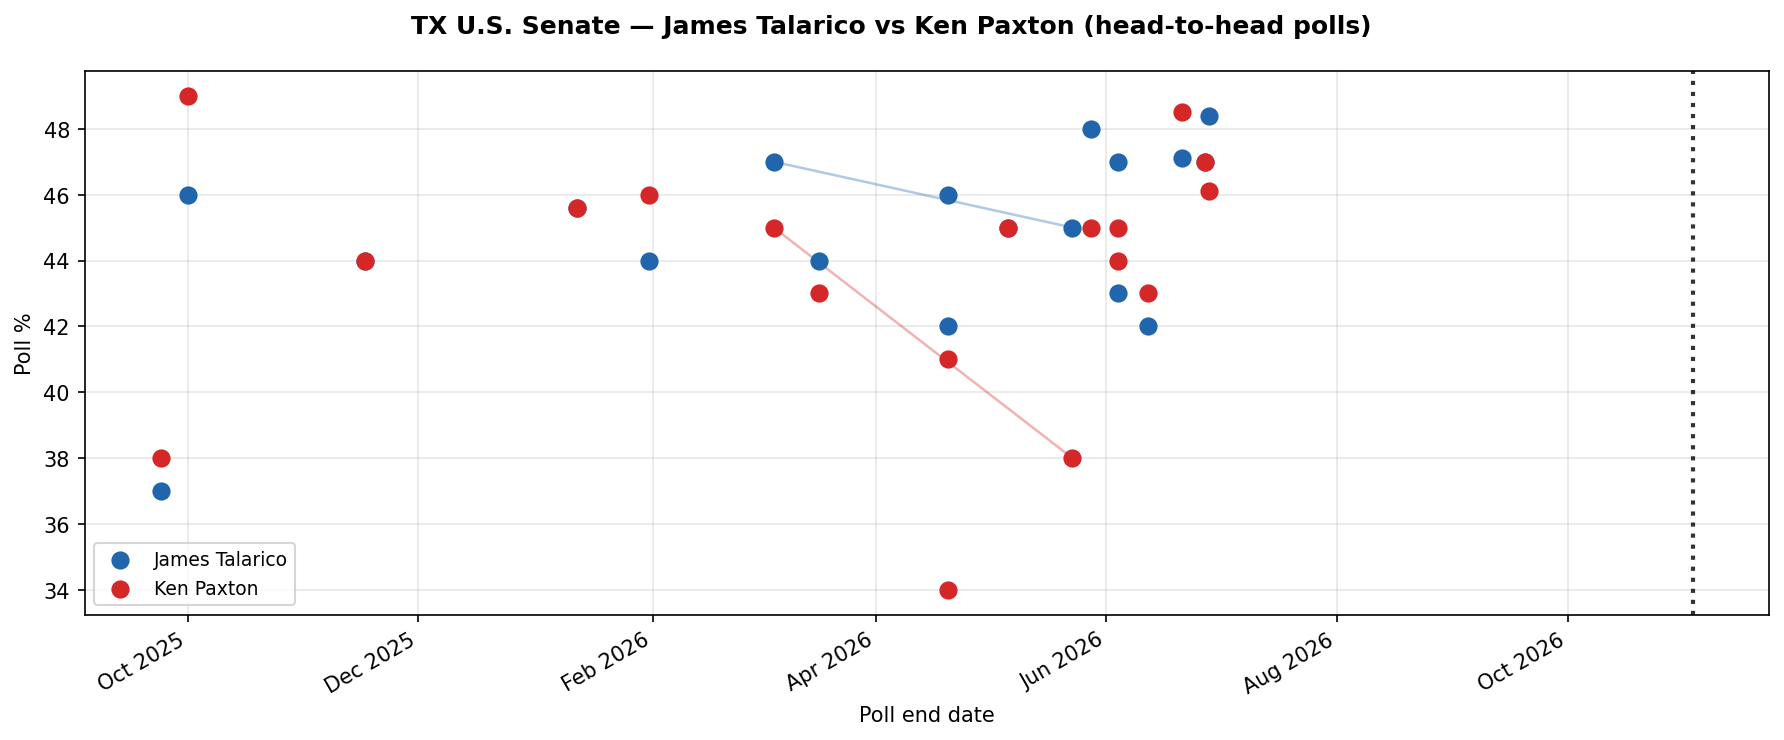
Texas U.S. Senate (Talarico vs. Paxton) — A2 Jun 28 — Talarico 48.4%, Paxton 46.1%; NYT/Siena Jun 27 tied 47%.
Maine Senate — Platner vs. Collins
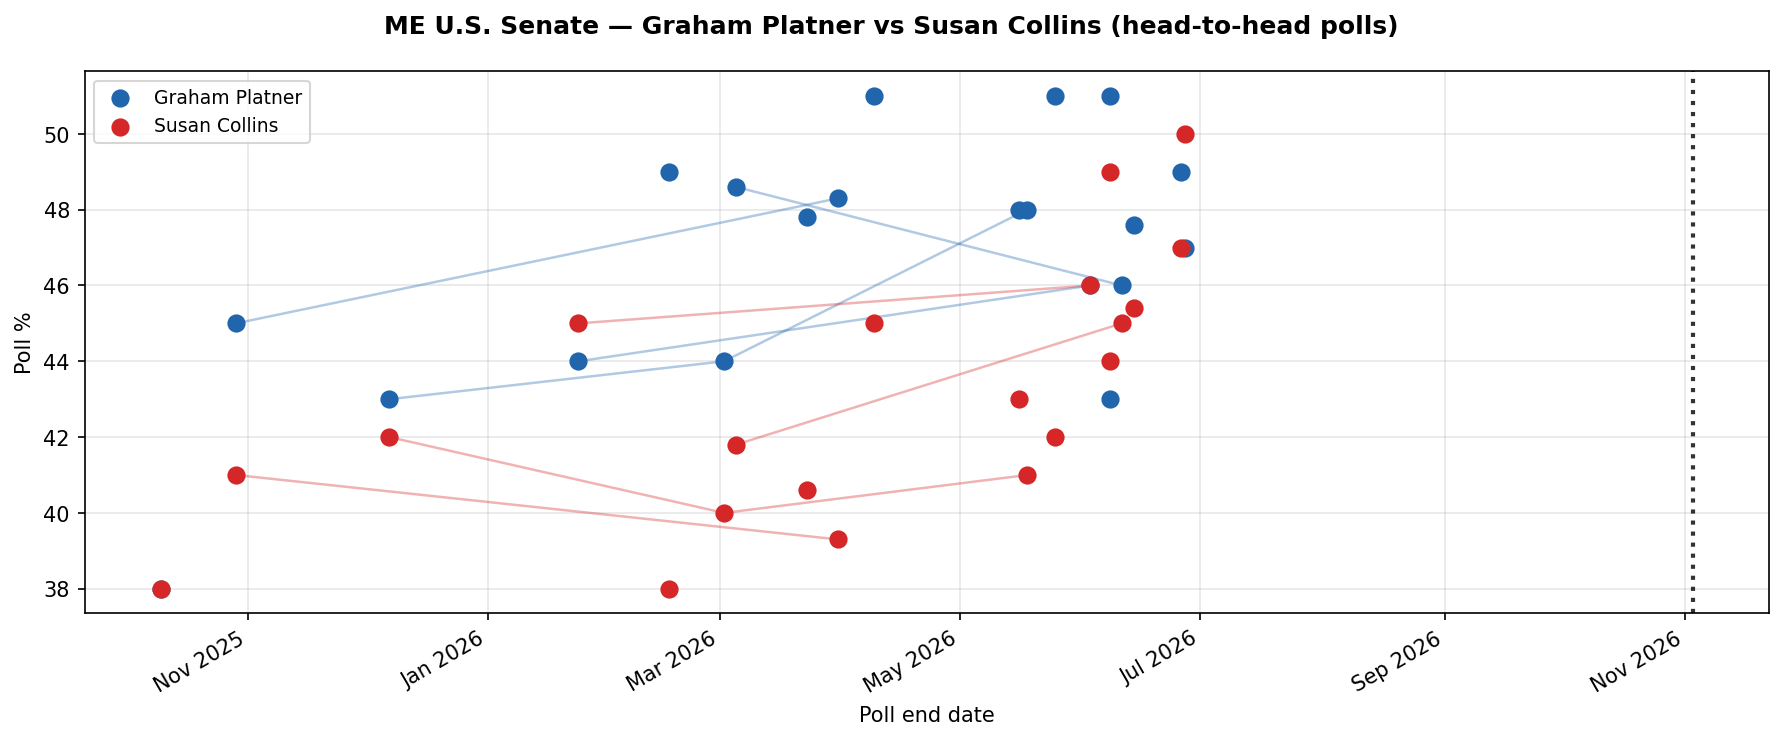
Maine U.S. Senate (Platner vs. Collins) — Platner out (Jul 8). Pre-withdrawal: Collins 50%, Platner 47%. Replacement race forming.
Prospective preregistration
On June 14, 2026, I preregistered directional predictions for three 2026 U.S. Senate races on the Open Science Framework, using the within-pollster variance decomposition (Movement Index and Signal Ratio) — not conventional win-probability forecasts.
Preregistered races: Kentucky (Charles Booker vs Andy Barr), Texas (James Talarico vs Ken Paxton), Maine (Graham Platner vs Susan Collins).
What was specified in advance: For each race, whether one candidate would show elevated within-pollster variance (and, for Texas, sustained Signal Ratio thresholds), plus falsification criteria and minimum polling rules. Predictions were made before examining variance data for these races beyond topline averages.
Frozen registration: OSF preregistration (June 14, 2026) · Project: https://osf.io/k6c7b/
Weekly Senate briefings — Kentucky, Texas, Maine. Movement Index and fragility scorecard, updated every week as the 2026 cycle progresses.
Data: VoteHub Polling API (generic congressional ballot). Kentucky Senate: curated public polls (PPP, Emerson/FOX56); VoteHub when available. Method described in my paper on within-pollster variance decomposition: https://papers.ssrn.com/sol3/papers.cfm?abstract_id=6863938. Code and 2024 replication on GitHub (github.com/rstil2/polling-fragility).